Getting started with your own data
To use this package with your own data, you will need labeled
.wav files organized by class. Each class should have its
own folder, with at least one class designated as ‘noise’ to help the
model distinguish target signals from background sounds.
Preparing your data
-
Organize Your Data:
Create a separate folder for each class, ensuring that all
.wavfiles belonging to a class are placed in the corresponding folder.-
Example directory structure:
my_data/
├── bird_1/
│   ├── file1.wav
│   ├── file2.wav
│   └── ...
├── noise/
│   ├── file1.wav
│   ├── file2.wav
│   └── ...
-
Ensure Consistent File Formats:
- All
.wavfiles should have the same sample rate to maintain consistency in training.
- Make sure that each folder contains only .wav files corresponding to the correct label. Incorrect labeling can lead to poor model performance.
- All
-
Generating Spectrogram Images:
- The
spectrogram_imagesfunction will convert.wavfiles into spectrogram images for training.
- You can specify the frequency range, output paths, and dataset split proportions (training, validation, and test). To follow machine learning best practices, your test data should be completely separate from training and validation sets.
- The
Example code to process your own data
# Define your dataset path
MyDatapath <- "path/to/your/data"

# Create spectrogram images from your labeled .wav files
spectrogram_images(
  trainingBasePath = MyDatapath,
  outputBasePath = "data/trainingimages/",
  minfreq.khz = 0.4,
  maxfreq.khz = 1.6,
  random = FALSE,
  splits = c(0.7, 0.3, 0.0), # Adjust training, validation, and test split as needed
  new.sampleratehz = "NA"
)
Getting started with multi-class example data.
For more information on the example data included please refer to: https://zenodo.org/records/14213067.
To follow best practices we want to use training and test data from different passive acoustic monitoring arrays. These clips are from Danum Valley Conservation Area, Sabah, Malaysia, but are taken from two different arrays. The “spectrogram_images” function takes folders organized and labeled by signal type, and creates training, validation, or test folders using the “splits” specified in the function call. In the example below 70% of the data is used for training and 30% for validation.
We create spectrogram images of the sound files.
# Link to training clips on Zenodo
ZenodoLink <- "https://zenodo.org/records/14213067/files/trainingclips.zip?download=1"

# Create data folder in your working directory
dir.create("data")

# Download into specified zip file location
download.file(url = ZenodoLink, destfile = "data/trainingclips.zip", method = "curl")

# Unzip folder
exdir <- "data/"
utils::unzip(zipfile = "data/trainingclips.zip", exdir = exdir)

# Check folder composition
TrainingDatapath <- paste(exdir, "trainingclips", sep = "")

# Check folder names
list.files(TrainingDatapath)

# Create spectrogram images
spectrogram_images(
  trainingBasePath = TrainingDatapath,
  outputBasePath = "data/trainingimages/",
  minfreq.khz = 0.4,
  maxfreq.khz = 1.6,
  random = FALSE,
  splits = c(0.7, 0.3, 0), # Assign proportion to training, validation, or test folders
  new.sampleratehz = "NA"
)
This dataset contains five classes including: female northern grey gibbons, helmeted hornbills, rhinoceros hornbills, and great argus pheasants. The data also contain a noise category.
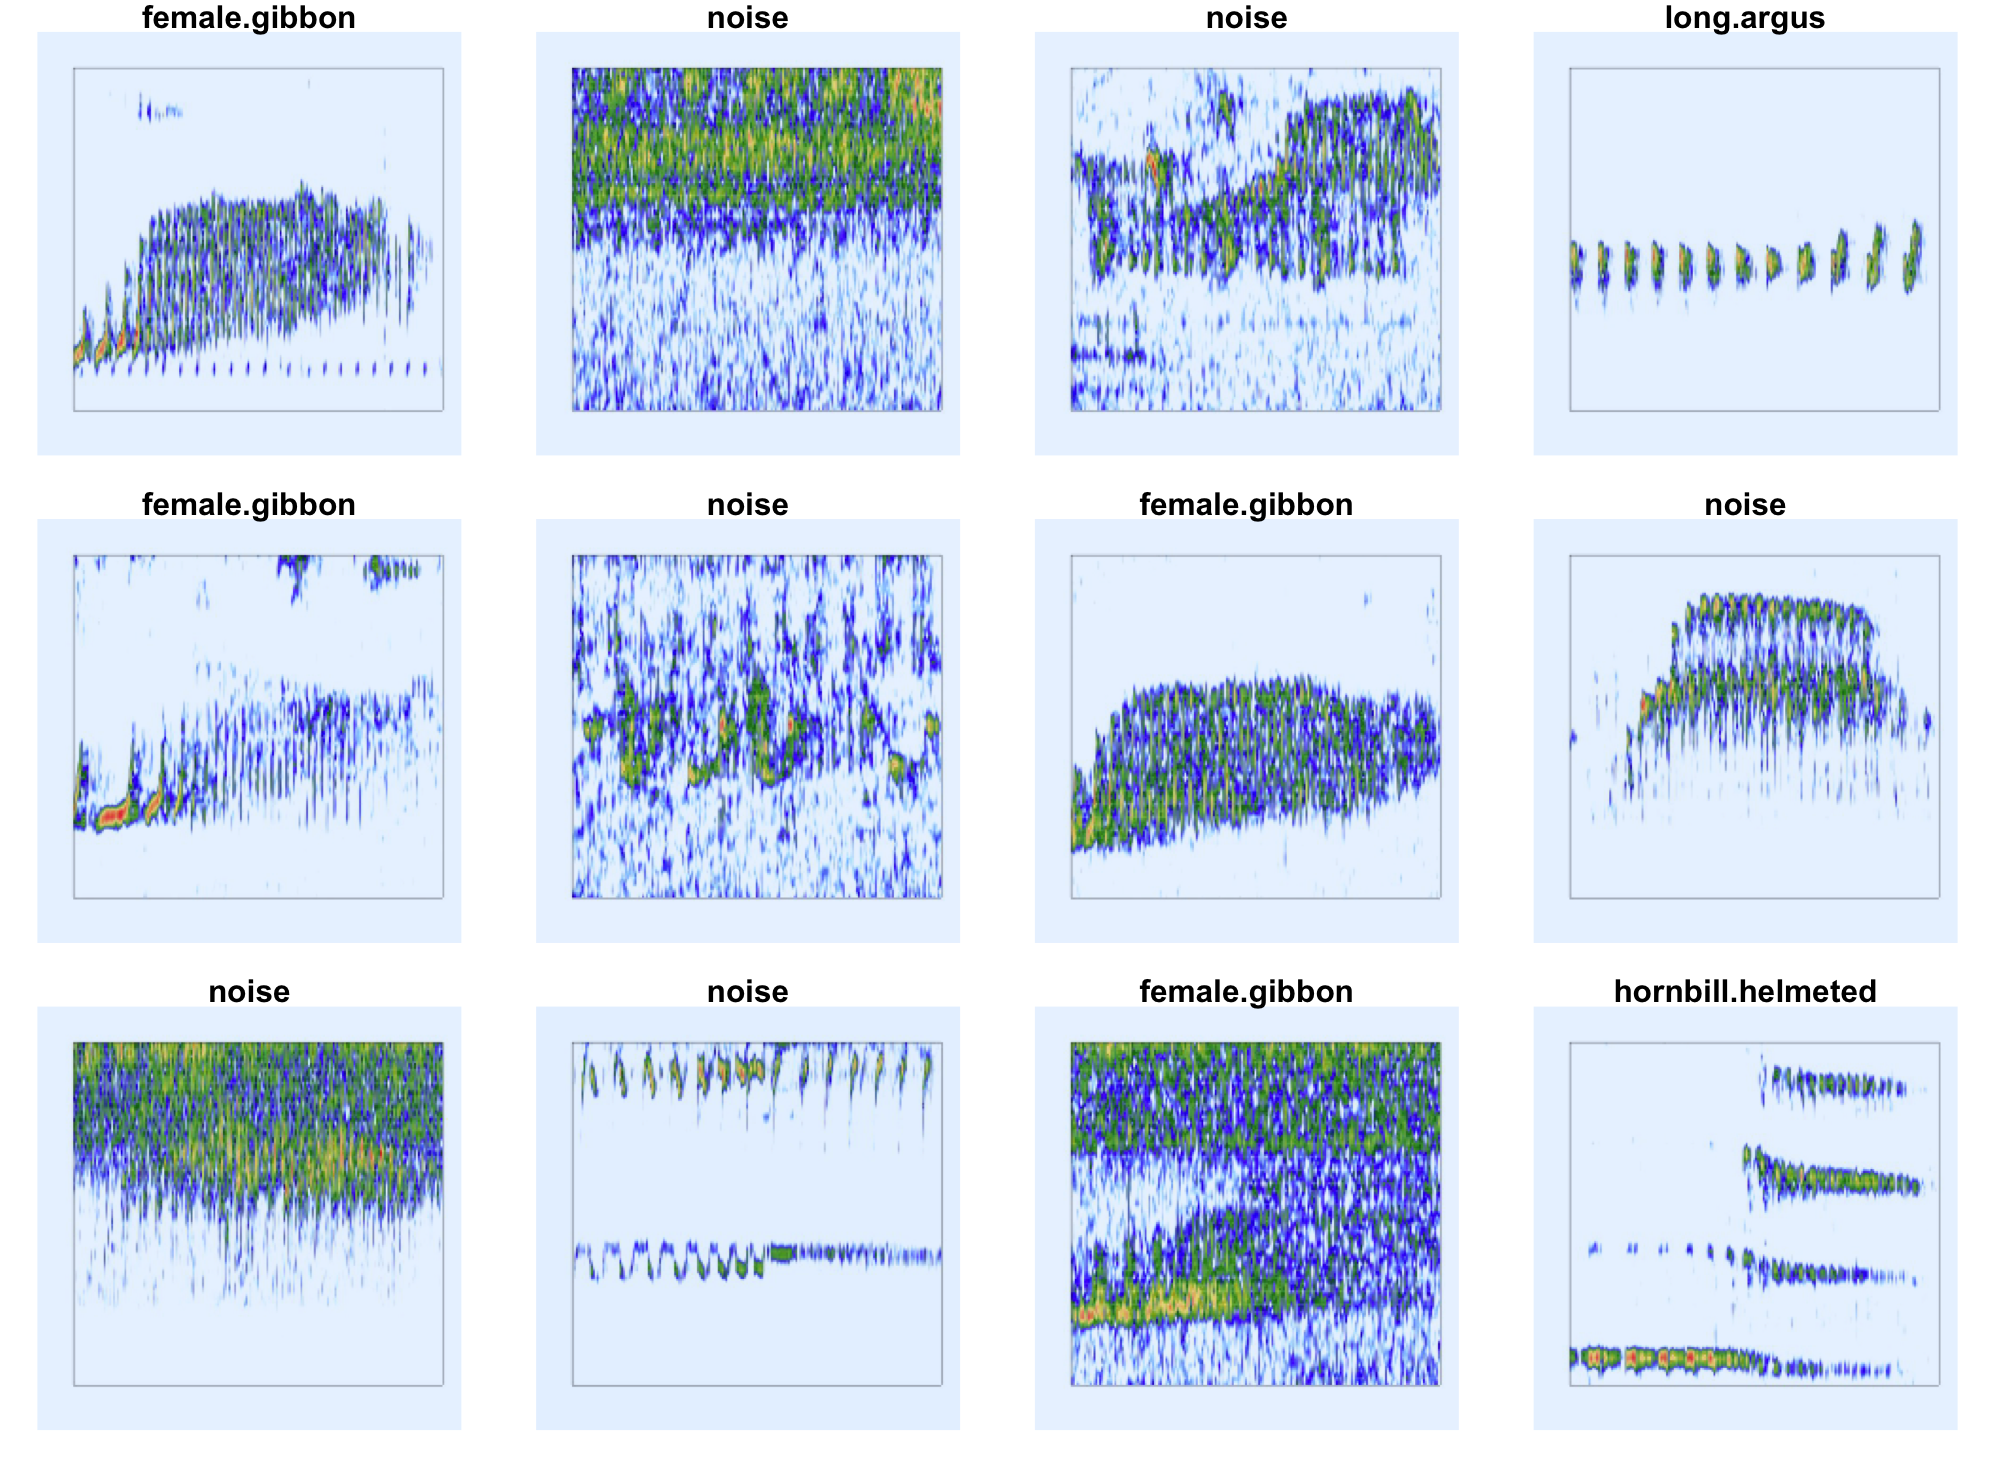
“Representative spectrogram images”
Download example test files on Zenodo and convert to spectrogram images
The “spectrogram_images” function below puts 100% of the test images into the test folder. This dataset contains the same five classes as the training data.
library(gibbonNetR)

# Link to multi-class test clips on Zenodo
ZenodoLink <- "https://zenodo.org/records/14213067/files/testclips.zip?download=1"

# Download into specified zip file location
download.file(url = ZenodoLink, destfile = "data/testclips.zip", method = "curl")

# Unzip folder
exdir <- "data/"
utils::unzip(zipfile = "data/testclips.zip", exdir = exdir)

# Check folder composition
TestDatapath <- paste(exdir, "testclips", sep = "")

# Check folder names
list.files(TestDatapath)

# Create spectorgram images
spectrogram_images(
  trainingBasePath = TestDatapath,
  outputBasePath = "data/testimages/",
  minfreq.khz = 0.4,
  maxfreq.khz = 1.6,
  splits = c(0, 0, 1), # Assign proportion to training, validation, or test folders
  new.sampleratehz = "NA"
)
Get started with binary example data.
We create spectrogram images of the binary sound files.
# Link to training clips on Zenodo
ZenodoLink <- "https://zenodo.org/records/14213067/files/trainingclipsbinary.zip?download=1"

# Create data folder in your working directory
dir.create("data")

# Download into specified zip file location
download.file(url = ZenodoLink, destfile = "data/trainingclipsbinary.zip", method = "curl")

# Unzip folder
exdir <- "data/"
utils::unzip(zipfile = "data/trainingclipsbinary.zip", exdir = exdir)

# Check folder composition
TrainingDatapath <- paste(exdir, "trainingclipsbinary", sep = "")

# Check folder names
list.files(TrainingDatapath)

# Create spectrogram images
spectrogram_images(
  trainingBasePath = TrainingDatapath,
  outputBasePath = "data/trainingimagesbinary/",
  minfreq.khz = 0.4,
  maxfreq.khz = 1.6,
  random = FALSE,
  splits = c(0.7, 0.3, 0), # Assign proportion to training, validation, or test folders
  new.sampleratehz = "NA"
)
Download example test files on Zenodo and convert to spectrogram images
The “spectrogram_images” function below puts 100% of the test images into the test folder.
library(gibbonNetR)

# Link to training clips on Zenodo
ZenodoLink <- "https://zenodo.org/records/14213067/files/testclipsbinary.zip?download=1"

# Download into specified zip file location
download.file(url = ZenodoLink, destfile = "data/testclipsbinary.zip", method = "curl")

# Unzip folder
exdir <- "data/"
utils::unzip(zipfile = "data/testclipsbinary.zip", exdir = exdir)

# Check folder composition
TestDatapath <- paste(exdir, "testclipsbinary/test/", sep = "")

# Check folder names
list.files(TestDatapath)

# Check folder names
list.files(TestDatapath)

# Create spectorgram images
spectrogram_images(
  trainingBasePath = TestDatapath,
  outputBasePath = "data/testimagesbinary/",
  minfreq.khz = 0.4,
  maxfreq.khz = 1.6,
  splits = c(0, 0, 1), # Assign proportion to training, validation, or test folders
  new.sampleratehz = "NA"
)