Extract Best Performance Results from Performance Tables
Source:R/get_best_performance.R
get_best_performance.RdGiven the path to a directory of performance tables, this function reads in the tables, combines them, and extracts the best performance results based on various criteria.
get_best_performance(
  performancetables.dir,
  model.type = "multi",
  class = "hornbill.helmeted",
  Thresh.val = 0.5
)
Arguments
- performancetables.dir
Path to the directory containing the performance tables.
- model.type
Type of model architecture. If 'multi' then will treat as multiclass, otherwise will treat as binary.
- class
Specific class for evaluation.
- Thresh.val
Threshold value for evaluation.
Value
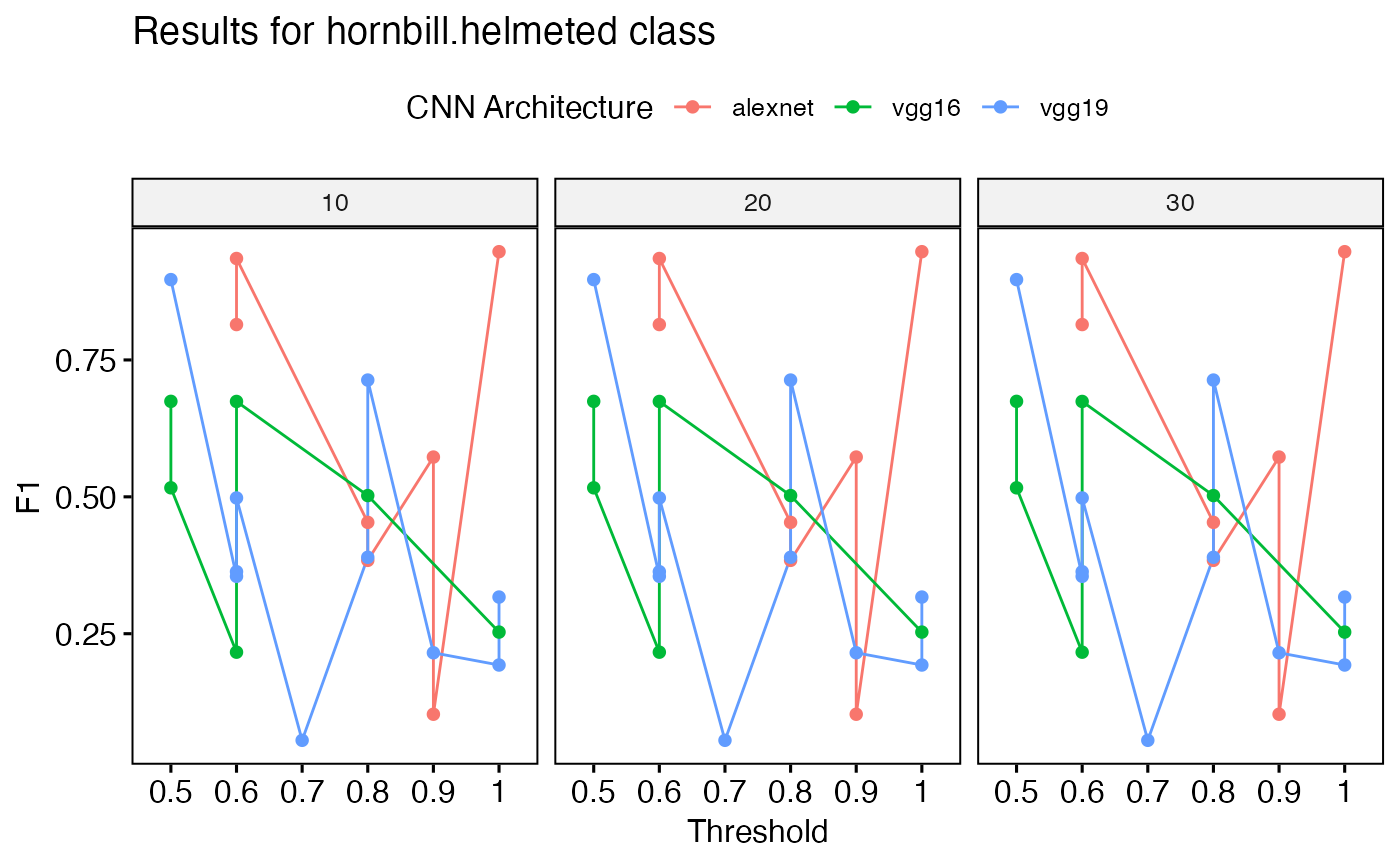
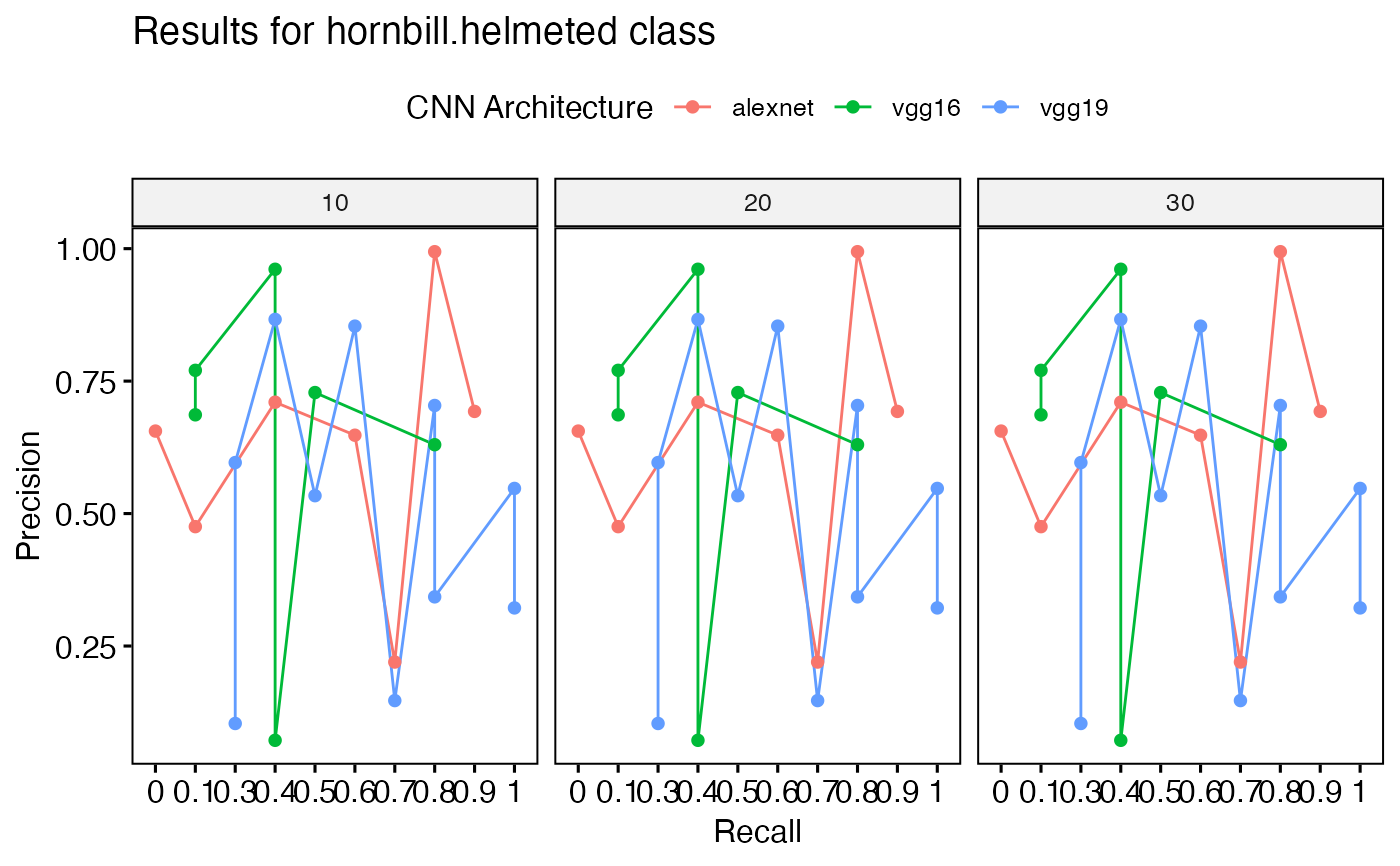
A list containing best F1 scores, best precision results, best recall results, and plots visualizing these metrics.
Note
'train_CNN_binary' and 'train_CNN_multi' output a directory of 'performance tables'. This function requres that directory as input.
Examples
{
  # Simulate data for performance tables
  set.seed(123)

  #' Set directory
  performance_tables_dir <- paste(tempdir(), "/performance_tables/", sep = "")

  #' Create directory for performance tables (NOTE THIS IS FOR TESTING ONLY)
  dir.create(performance_tables_dir, showWarnings = FALSE, recursive = TRUE)

  #' Define list of model architectures
  architectures <- c("alexnet", "vgg16", "vgg19")

  #' Define list of training datasets
  training_datasets <- c("Dataset1", "Dataset2", "Dataset3")

  #' Create performance tables
  for (arch in architectures) {
    for (td in training_datasets) {
      #' Generate random performance metrics
      metrics <- data.frame(
        Class = rep(c("hornbill.helmeted", "other.class"), each = 5),
        "Training Data" = rep(td, 10),
        "CNN Architecture" = rep(arch, 10),
        Threshold = runif(10, 0, 1),
        F1 = runif(10, 0, 1),
        Precision = runif(10, 0, 1),
        Recall = runif(10, 0, 1),
        AUC = runif(10, 0, 1),
        `N epochs` = rep(c(10, 20, 30), each = 10)
      )

      # Reassign column names
      colnames(metrics) <- c(
        "Class",
        "Training Data", "CNN Architecture",
        "Threshold", "F1", "Precision",
        "Recall", "AUC", "N epochs"
      )
      #' Write data to CSV file
      filename <- paste0(performance_tables_dir, arch, "_", td, ".csv")
      write.csv(metrics, filename, row.names = FALSE)
    }
  }


  #' Call the function with default parameters
  results <- get_best_performance(performancetables.dir = performance_tables_dir, )

  # NOTE: Results will not make sense as it is random
  #' message the best F1 scores
  message("Best F1 scores:")
  print(results$best_f1)

  #' message the best precision results
  message("Best precision results:")
  print(results$best_precision)

  #' message the best recall results
  message("Best recall results:")
  print(results$best_recall)

  #' message the best AUC results
  message("Best AUC results:")
  print(results$best_auc)

  #' Plot F1 scores
  print(results$f1_plot)

  #' Plot precision-recall curve
  print(results$pr_plot)
}
#> Evaluating performance for hornbill.helmeted Here are the present classes: hornbill.helmetedEvaluating performance for hornbill.helmeted Here are the present classes: other.class
#> Best F1 scores:
#> # A tibble: 9 × 9
#>   Class      `Training Data` `CNN Architecture` Threshold    F1 Precision Recall
#>   <chr>      <chr>           <chr>                  <dbl> <dbl>     <dbl>  <dbl>
#> 1 hornbill.… Dataset1        vgg19                  0.779 0.713     0.147  0.738
#> 2 hornbill.… Dataset1        vgg19                  0.779 0.713     0.147  0.738
#> 3 hornbill.… Dataset1        vgg19                  0.779 0.713     0.147  0.738
#> 4 hornbill.… Dataset2        vgg19                  0.515 0.897     0.866  0.373
#> 5 hornbill.… Dataset2        vgg19                  0.515 0.897     0.866  0.373
#> 6 hornbill.… Dataset2        vgg19                  0.515 0.897     0.866  0.373
#> 7 hornbill.… Dataset3        alexnet                0.954 0.948     0.220  0.737
#> 8 hornbill.… Dataset3        alexnet                0.954 0.948     0.220  0.737
#> 9 hornbill.… Dataset3        alexnet                0.954 0.948     0.220  0.737
#> # ℹ 2 more variables: AUC <dbl>, `N epochs` <dbl>
#> Best precision results:
#> # A tibble: 9 × 9
#>   Class      `Training Data` `CNN Architecture` Threshold    F1 Precision Recall
#>   <chr>      <chr>           <chr>                  <dbl> <dbl>     <dbl>  <dbl>
#> 1 hornbill.… Dataset1        alexnet                0.883 0.573     0.994 0.795
#> 2 hornbill.… Dataset1        alexnet                0.883 0.573     0.994 0.795
#> 3 hornbill.… Dataset1        alexnet                0.883 0.573     0.994 0.795
#> 4 hornbill.… Dataset2        vgg16                  0.962 0.253     0.961 0.428
#> 5 hornbill.… Dataset2        vgg16                  0.962 0.253     0.961 0.428
#> 6 hornbill.… Dataset2        vgg16                  0.962 0.253     0.961 0.428
#> 7 hornbill.… Dataset3        vgg16                  0.531 0.516     0.770 0.0580
#> 8 hornbill.… Dataset3        vgg16                  0.531 0.516     0.770 0.0580
#> 9 hornbill.… Dataset3        vgg16                  0.531 0.516     0.770 0.0580
#> # ℹ 2 more variables: AUC <dbl>, `N epochs` <dbl>
#> Best recall results:
#> # A tibble: 0 × 9
#> # ℹ 9 variables: Class <chr>, Training Data <chr>, CNN Architecture <chr>,
#> #   Threshold <dbl>, F1 <dbl>, Precision <dbl>, Recall <dbl>, AUC <dbl>,
#> #   N epochs <dbl>
#> Best AUC results:
#> # A tibble: 9 × 9
#>   Class      `Training Data` `CNN Architecture` Threshold    F1 Precision Recall
#>   <chr>      <chr>           <chr>                  <dbl> <dbl>     <dbl>  <dbl>
#> 1 hornbill.… Dataset1        vgg19                  0.779 0.713     0.147 0.738
#> 2 hornbill.… Dataset1        vgg19                  0.779 0.713     0.147 0.738
#> 3 hornbill.… Dataset1        vgg19                  0.779 0.713     0.147 0.738
#> 4 hornbill.… Dataset2        vgg19                  0.515 0.897     0.866 0.373
#> 5 hornbill.… Dataset2        vgg19                  0.515 0.897     0.866 0.373
#> 6 hornbill.… Dataset2        vgg19                  0.515 0.897     0.866 0.373
#> 7 hornbill.… Dataset3        vgg16                  0.531 0.516     0.770 0.0580
#> 8 hornbill.… Dataset3        vgg16                  0.531 0.516     0.770 0.0580
#> 9 hornbill.… Dataset3        vgg16                  0.531 0.516     0.770 0.0580
#> # ℹ 2 more variables: AUC <dbl>, `N epochs` <dbl>